Two months ago, me and 5 other CS students at UCC decided to build a web-based urban traffic simulator. The kind where you open a browser, pick a city in the world, and watch thousands of virtual people commute to work, drop kids off at school, and sit in traffic outside the English Market.
We shipped it. It’s live at trafficjam.app. This is the story of how that went.
Why traffic simulation
Traffic in Cork is genuinely bad. Bad enough that it felt like a legit problem worth hacking on. Anyone who’s tried to take a bus across the city during rush hour knows what I mean, and anyone who works in city planning knows how expensive it is to figure out what to do about it.
The tools that exist for this are either outrageously expensive (Vissim charges enterprise licensing fees) or built for people who enjoy hand-editing XML files in a terminal.
One of these tools - MATSim - is incredibly powerful. It also requires you to
know a ton of stuff about how to configure, run and visualize it. You need to
manually generate a config.xml, interpret compressed event logs that have
hundreds of thousands of entries, manually generate thousands of lines of agent
plans, specifying how these “virtual people” must move around the city - from
which building to start, to which building to go to school and to which building
to go to work or to the supermarket. And on top of all this you need a third
party tool to be able to visualize your matsim simulation. It’s built for
transport researchers, not city planners, and definitely not for a 60-year-old
council member wondering if closing a road will make things better or worse.
We wanted to build the layer on top of it. Import a city, modify it, run a simulation, watch it happen without knowing intricate details about how things run.
The stack
Before getting into the war stories, here’s an overview of what we actually built:
- map-data-service - FastAPI + PostGIS. Serves road networks from a pre-loaded OpenStreetMap database of all Ireland.
- trafficjam-be - FastAPI orchestrator. Takes a network from the frontend, generates agent plans, kicks off simulations, and streams events back via SSE.
- simengine - Spring Boot wrapping MATSim. Runs the actual simulation and fires events into NATS JetStream as they happen.
- trafficjam-fe - React + TypeScript + Deck.gl + Mapbox. Map editor, simulation visualizer, charts.
All deployed on a Hetzner VPS via Coolify.
Investigations & Research
At first we didn’t even know where to start. We were 6 engineers with a vague vision of what we wanted but no strict plan, no product requirements and no organisation. Here came some of the project management and team organisation things I’ve learned while working as an SRE at Dailypay under Fearghal Conn and Chad Lykken. We created a project board in Linear. A minimalistic roadmap and a few swim lanes for each initiative. We adopted the concept of ‘investigations’ - small scoped tasks with the goal of shining light on unknowns, and believe me at the start we had a lot.
Investigations also served as design docs for the project. An investigation consisted of a markdown file going through the problem and possible solutions that was then reviewed via a GitHub PR and pushed to the project repo. The value is that future-you (or a teammate at 11pm) can see why a decision was made, not just what was decided.
After an initial week of pretty much solely investigations, tickets were cut from those investigations for each of the aforementioned swim-lanes/initiatives.
Initial steps, getting map data and scaffolding
The tech stack and architecture mentioned above did not come to us immediately. Quite the opposite - it grew with the project. We wanted to keep things as minimal as possible from the start, but as the requirements and limitations became more and more clear the architecture grew.
At first we just wanted to show some map links in the frontend and have the user be able to edit them (later we found out that the “editing” part was not as easy as we initially thought - many thanks to Carlos Reverter for handling most of this part).
The original plan was to call the Overpass API - a public API to get OpenStreetMap data - directly from the browser. User clicks import, frontend queries Overpass, road network appears on the map. Clean, simple, no backend needed for data loading.
It looked fine during the investigation. Then we started hitting it heavily during development and it became a mess. Rate limiting. Timeouts on anything larger than a small district. Since Overpass was a public API it rate limited everyone heavily. The map loading that was supposed to feel seamless took 30+ seconds or just failed entirely.
The fix was obvious in hindsight: download the Ireland OSM dataset, load it into
PostGIS - a Postgres extension for handling spatial data
and serve it ourselves. That’s how our map-data-service was born. Now a
bounding-box query completed in milliseconds.
Thanks to Nathan Brosnan we were able to integrate of all this.
Wrapping MATSim into our own Simulation Engine service
MATSim is a Java framework that needs a lot of code to run properly. It uses the concept of “agents” and simulation scores to run simulations.
The idea is simple to lay out and pretty complex to code. It simulates the day of an agent - how it goes to school or work, how it goes home, where it goes shopping and when. All these plans create traffic, and based on how much time agents spend in traffic the score goes up or down. Multiple iterations are then run and agents try to find the best routes, not only the shortest path, based on the traffic of the previous “days”. At the end the simulation’s statistics and scores are exported in plain text format for you to analyze separately.
It requires:
A network to run the simulation on (in MATSim’s specific XML format)
A configuration specifying how routing and scoring should work
<module name="routing">
    <parameterset type="teleportedModeParameters">
        <param name="mode" value="car_passenger" />
        <param name="teleportedModeSpeed" value="13.88" />
        <param name="beelineDistanceFactor" value="1.3" />
    </parameterset>
    <parameterset type="teleportedModeParameters">
        <param name="mode" value="walk" />
        <param name="teleportedModeSpeed" value="1.34" />
        <param name="beelineDistanceFactor" value="1.3" />
    </parameterset>
</module>
A plan for each agent describing how they move around the city
<person id="uuid">
  <plan selected="yes">
    <act type="home" x="53.34" y="-6.26" end_time="07:45:00"/>
    <leg mode="car"/>
    <act type="work" x="53.33" y="-6.25" dur="08:00:00"/>
    <leg mode="car"/>
    <act type="home" x="53.34" y="-6.26"/>
  </plan>
</person>
Our simengine was responsible for creating a REST API with which we could
communicate with MATSim in a simpler manner. It acted both as a communication
layer and as a facade pattern - simplifying the complex interface of MATSim
and providing some sensible defaults.
Many thanks to Clancy Desilva for doing the bulk of that work.
For the agent plans we needed to combine a few things:
- Census data for the city - to make the simulations more realistic without burdening the user. This included how many people go to school on a given day, how many people are working and in which regions, and where residential buildings are located.
- A Python agent plan generation layer that, given a minimalistic configuration provided by the user via REST, generated said agent plans and provided them to our simengine.
Many thanks to Mert Mladenov for handling this part of the system.
An architectural decision: the event storage problem
As I mentioned, MATSim produces a lot of events. A simulation with a few thousand agents over Cork generates ~580,000 events. Each one is something like “agent 4821 left link 3094 and entered link 3095.”
We needed three things from these events: live streaming to the frontend while the simulation runs, replay for users who join late, and persistence so results stick around.
First attempt: store them in PostgreSQL. Row-by-row inserts at simulation speed. This just didn’t work - the write throughput wasn’t anywhere close to what MATSim was outputting. The database was already behind before the simulation was halfway done, and querying 580K rows back out for replay was too slow for anything real-time.
Second attempt: write them to a file (blob), serve the file on demand. This killed streaming. You’d have to pull the entire file into memory on the backend before you could start sending anything to the frontend. Users would wait for a multi-MB download before seeing a single agent move. Defeats the whole point.
Third attempt: NATS JetStream.
It solved our exact use-case. It is a message queue with built-in persistence and replay from any point. We publish events to a JetStream subject as they’re produced. The frontend subscribes and gets live updates. Late joiners replay from offset 0. Persistence is built in. This actually worked.
Later we found out that JetStream also supports “buckets” - a key-value blob storage solution similar to S3. Since we already had the infrastructure set up, we used it for some of the statistics and analytics output from MATSim at the end of each run.
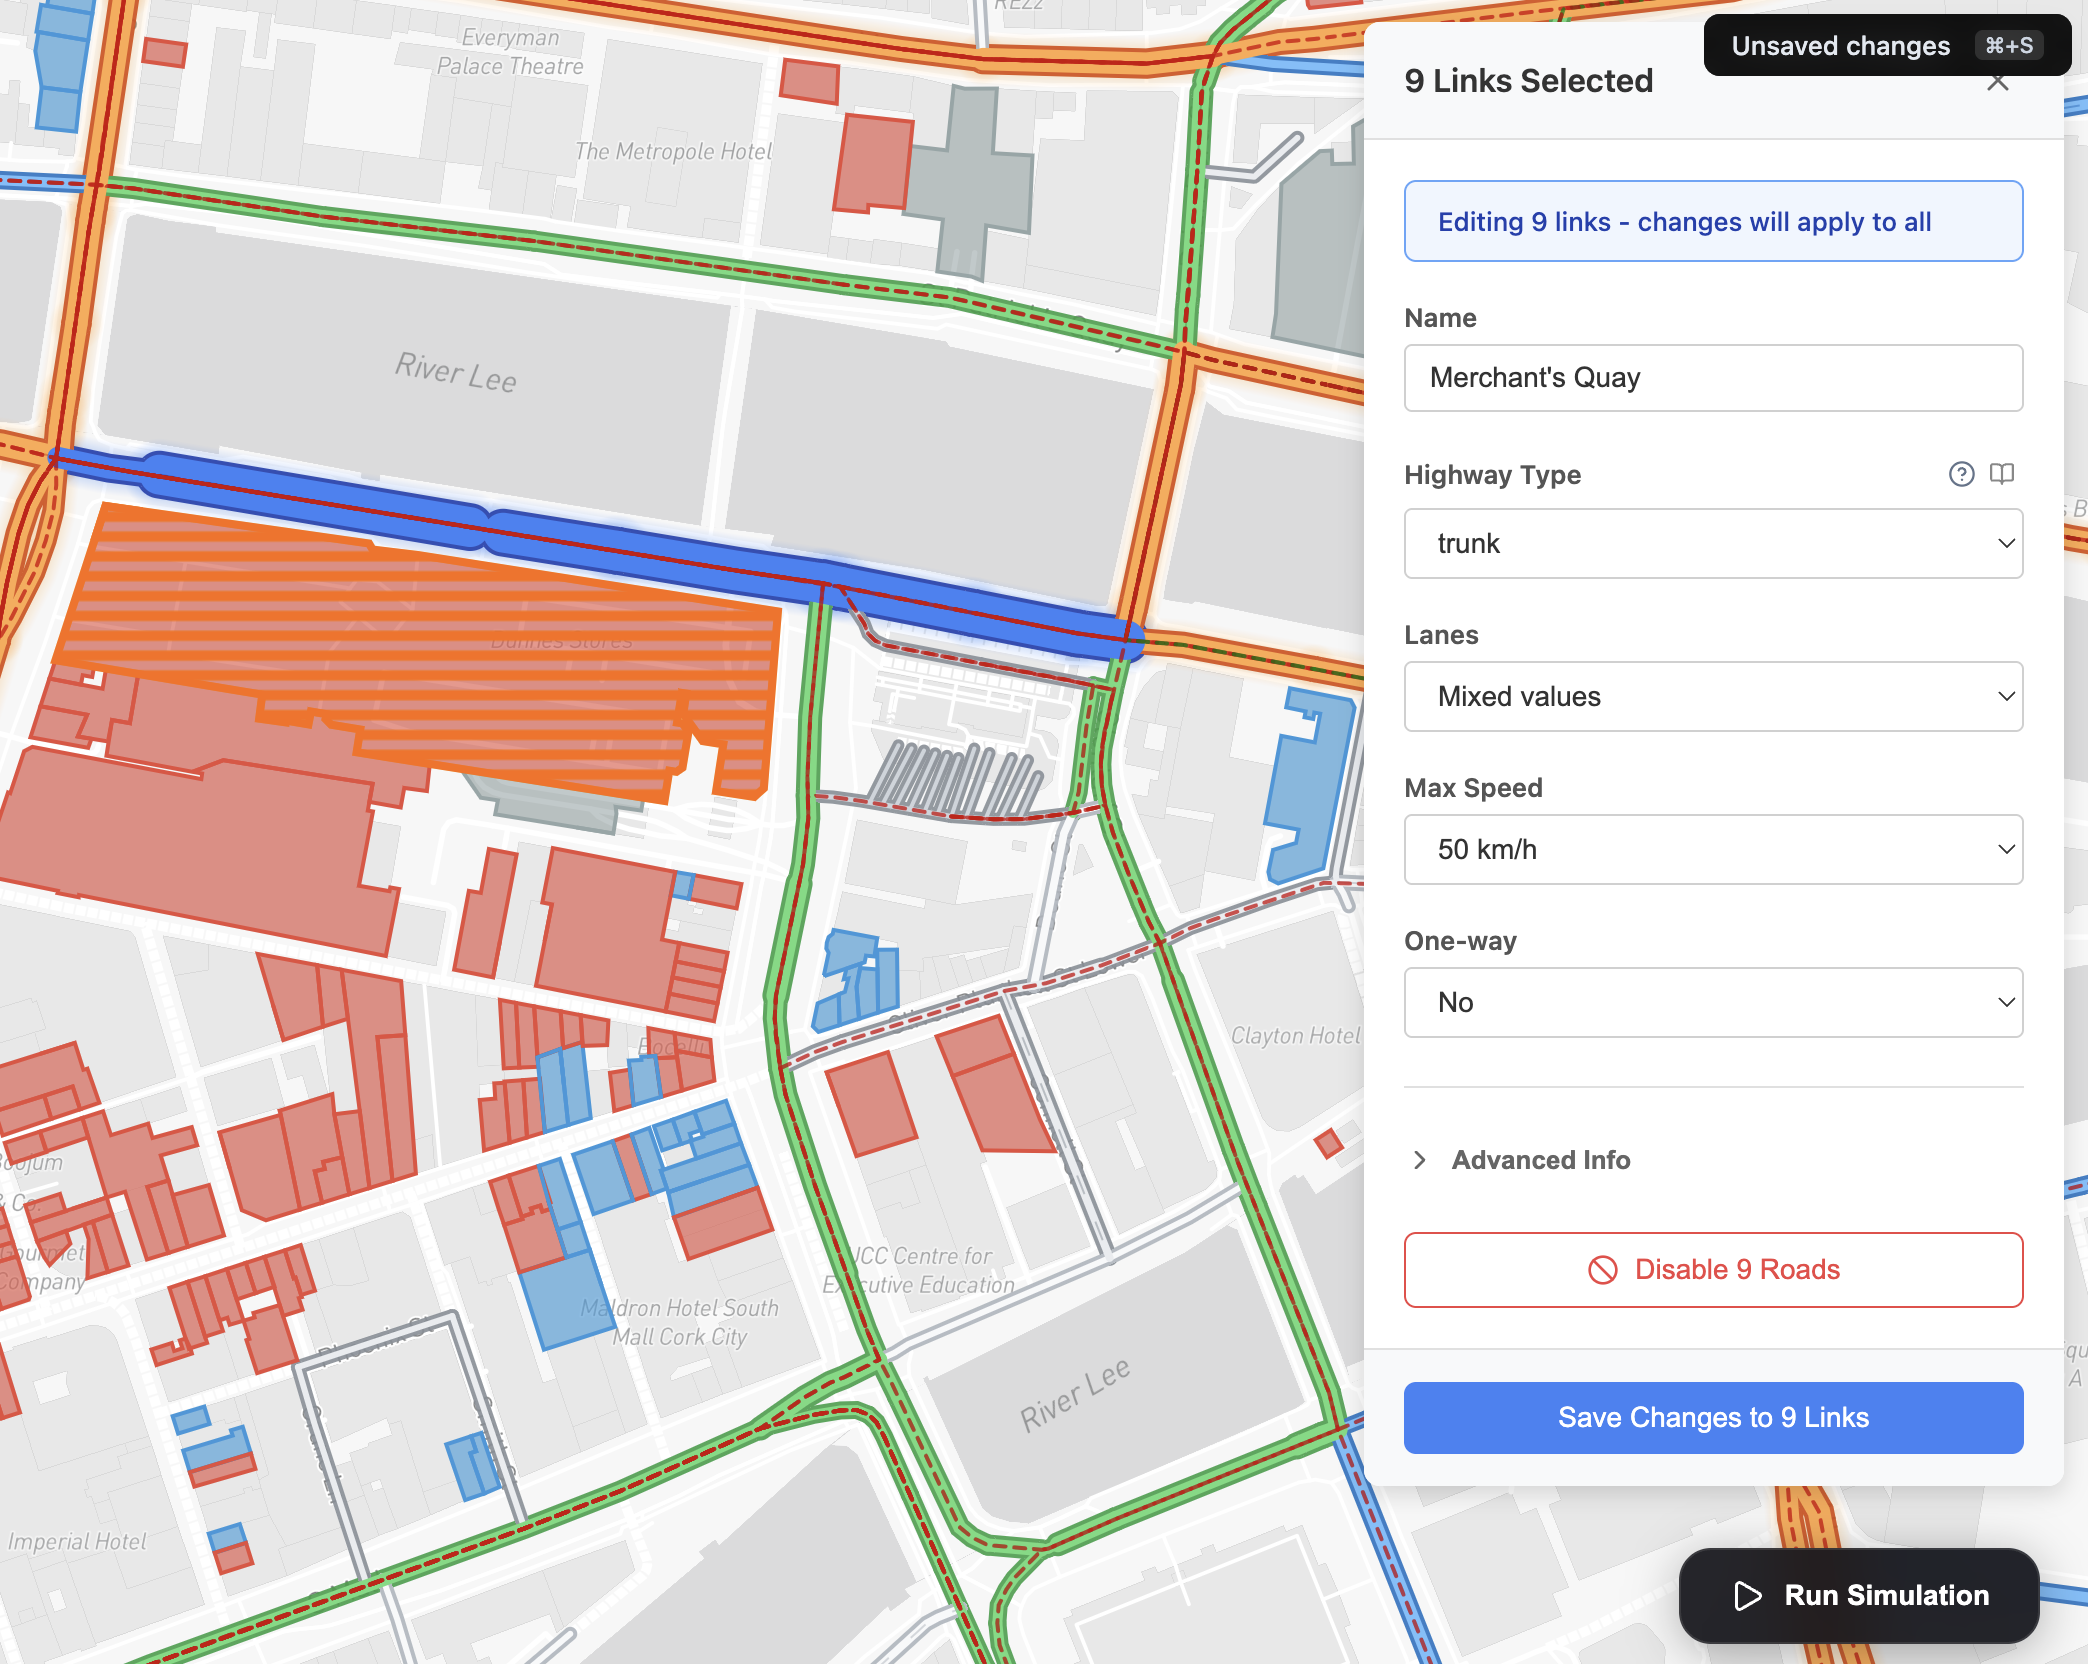
The map editor
The map editor was one of those features that sounds simple until you’re three weeks into it.
The core idea: show a network of roads as an editable graph. Users can drag nodes, add links, split roads, disable segments, change speed limits and lane counts. All changes persist and get diffed against the base network when you run a simulation.
What made it hard was React’s rendering model. Every drag event updates node positions, which updates link geometries, which triggers re-renders. Early on, dragging a node in a dense area caused the entire network to re-render on every mouse-move frame. On Cork’s city center with thousands of links, this was immediately unusable.
The fix was splitting into static and draft layers. During a drag, the original node and its connected links are filtered out of the static layer. A lightweight draft layer renders only the elements being manipulated - just the dragged node and its few connected links. The rest of the network doesn’t touch React at all. Mouse-up: draft disappears, static merges back. This made it smooth.
The interaction model is a chain of responsibility. onMouseDown tries handlers
in priority order: node dragging first, node adding second. First one that
returns true consumes the event. This kept the interaction logic readable even
as we added more modes - split link, multi-select, attribute editing.
Multi-select was a late addition and genuinely useful. Hold Cmd, click multiple roads, and you can change speed limits or lane counts across all of them at once. The panel detects mixed values (some selected links are 50 km/h, some are 80 km/h) and shows that clearly in the UI.
Many thanks to Carlos for handling most of this work.
The visualizer
MATSim is really just a framework for computing the traffic simulation - it gives you nothing for visualization. For visualizing the simulation and extracting powerful statistics and analytics we needed to build this ourselves.
We built a visualizer in React using deck.gl that handled streaming events one by one. The complexity was huge but with enough time and iterations we made something that looked right. It was definitely more beautiful than any of the existing solutions.
Agents that ignored the map entirely
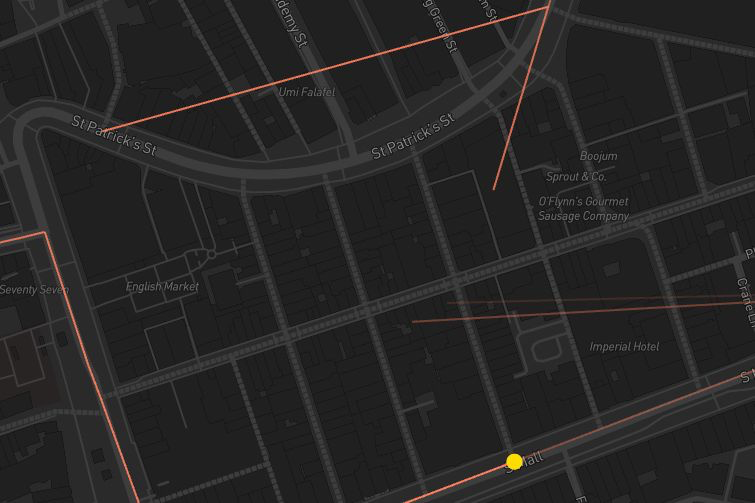
Agents routing “correctly” through the network while visually cutting straight through the English Market.
Early in the development of the visualizer, we had a bug that looked spectacular in the worst way. Agents were moving in perfectly straight lines between points on the map - slicing diagonally across St. Patrick’s Street, cutting through buildings, ignoring curves entirely. The simulation thought it was doing fine. Visually, it looked like something had gone badly wrong with physics.
The cause was embarrassingly simple once we found it. When we exported the road
network from OSM into MATSim’s format, we represented each link as just two
fields: from_node and to_node. The intersection at one end, the intersection
at the other. That’s technically correct - a link connects two nodes. But OSM
roads aren’t straight lines between intersections. They’re polylines with a
bunch of intermediate coordinate points describing the curve of the street.
{
  "type": "Feature",
  "geometry": {
    "type": "LineString",
    "coordinates": [
      [-8.4756, 51.8985],
      [-8.4751, 51.8983],
      [-8.4747, 51.8979],
      [-8.4743, 51.8976] // We forgot about these :)
    ]
  },
  "properties": {
    "id": "link-3094",
    "from_node": "node-201",
    "to_node": "node-202",
    "highway": "secondary"
  }
}
The fix was to include the full geometry of each link in the export - all the intermediate coordinates that define the shape of the road. Once we did that, agents started following the actual curves of Cork’s streets rather than teleporting between intersections in straight lines.
This was one of those bugs where the root cause made total sense once you saw it, but took a while to get to because the symptom (agents moving wrong) pointed you toward the visualizer rather than the network exporter. We wasted time staring at Deck.gl render code before tracing it back far enough.
Analytics & Insights
MATSim doesn’t really like doing the work for you beyond outputting how the simulation went - it’s your job to compute all the analytics around it.
Luckily some really smart folks from TU Berlin developed SimWrapper - a plugin for MATSim that allowed us to define via config statistics about the running simulation and have computed values ready to store and pull into the frontend.
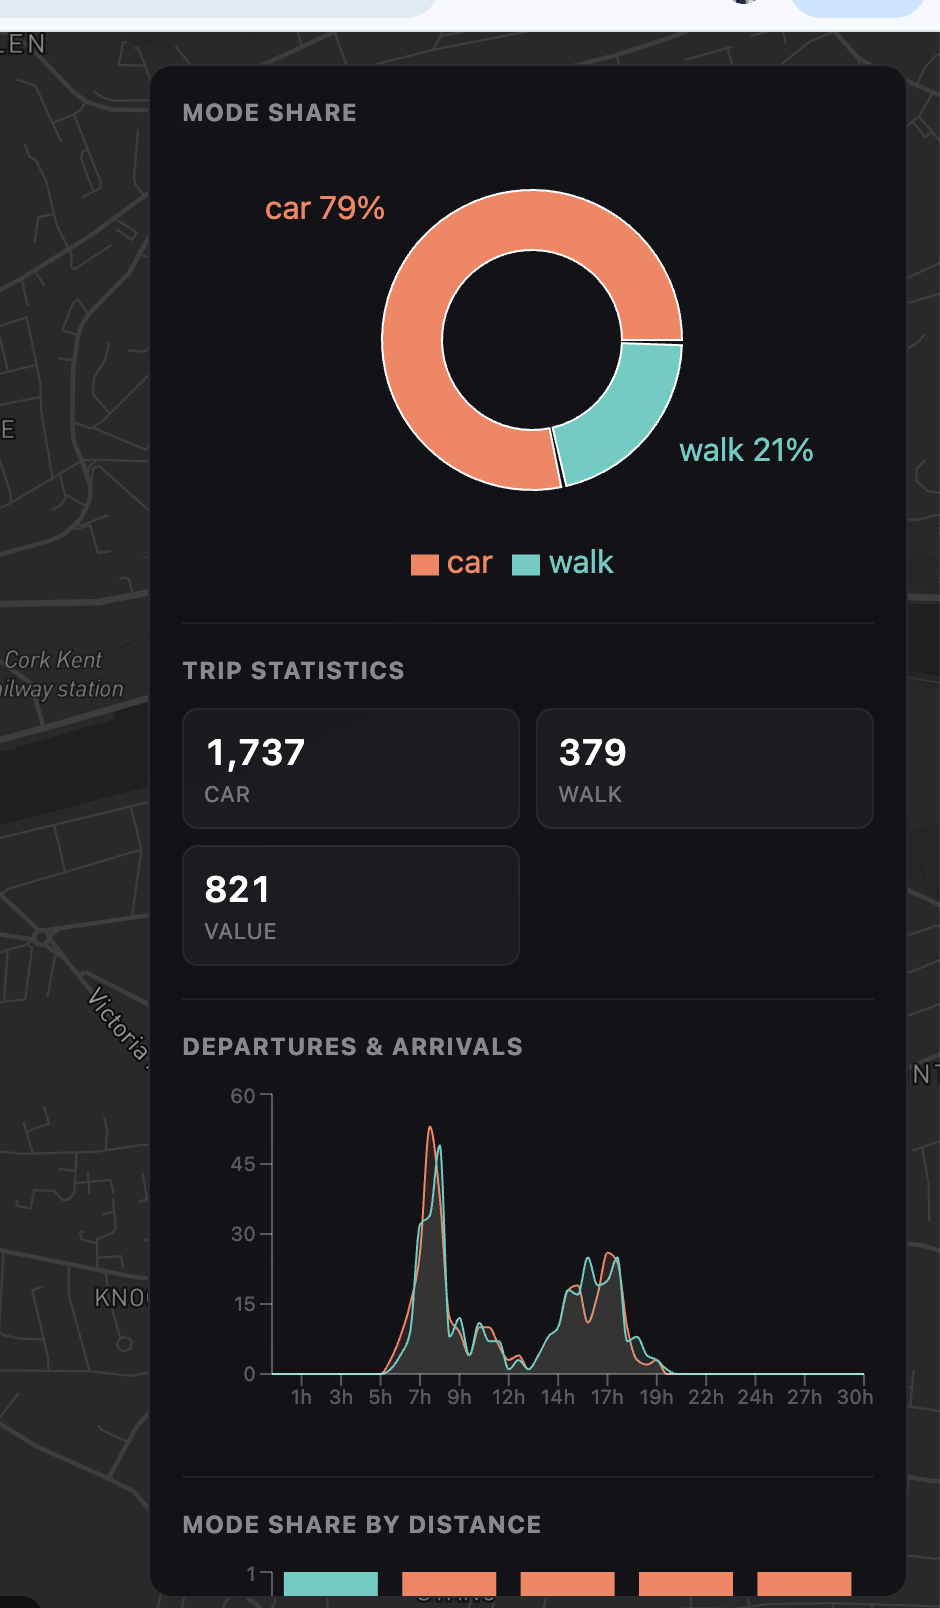
This also gave us a very important feature - the link volume view. After a simulation completes, you can switch to link volume view. Roads are color-coded by how many agents used them: cool blue for quiet streets, green for moderate, yellow for busy, red/orange for congested. It’s the single most immediately legible output the app produces, and the one that makes you go “oh, so that’s why Merchant’s Quay is always backed up.”
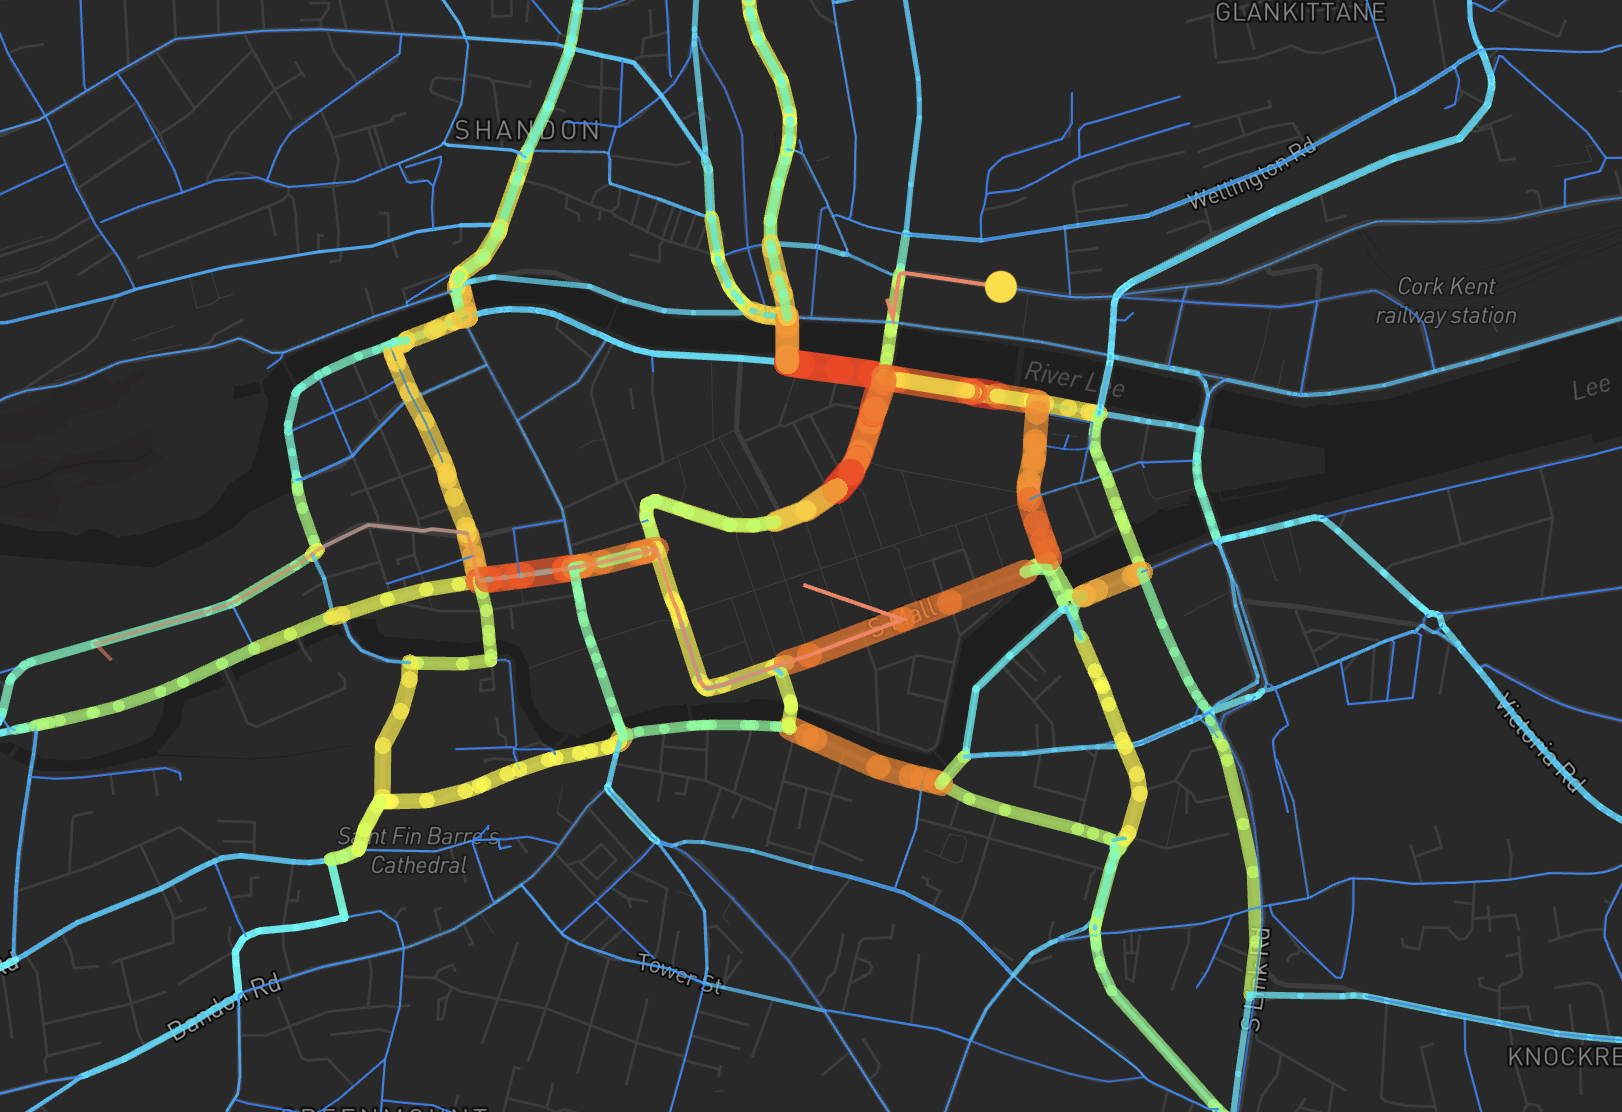
Many thanks to Michael Xuereb for figuring all this out.
Deployment and self-hosting via a VPS
Decisions around where and how to deploy all this were real trouble. We had one component that needed persistence (NATS JetStream), so a serverless option alone wouldn’t cut it. We thought about using a mounted bucket in GCS and deploying to Cloud Run, but this wouldn’t work due to costs and the fact that the simulation engine required a lot of RAM.
We opted for a less reliable but cheaper solution - a Hetzner VPS using Coolify to make deployments a bit less frustrating. Coolify is a self-hosted Heroku alternative that gives you one-click deployments for pre-made services.
One of the cool things Coolify allowed us to do was one-click deployment for pre-made services. This came in handy when we needed to write the final report for UCC - we couldn’t find an appropriate platform for 6 students to collaboratively edit Markdown for free, so we did the most reasonable thing and self-hosted our own collaborative Markdown editor at markdown.trafficjam.app. An exhilarating moment that showed us the power of taking control.
Shipping
Full demo:
The system we ended up with: load a city from a PostGIS-backed OSM database, edit the network in a browser, generate synthetic agents from census and building data, run MATSim remotely, stream 580K events through NATS into a Deck.gl visualizer, show post-run analytics from SimWrapper output. All in a browser, no config files, no terminal.
That’s not a small thing to ship in two months, with six people, while also taking other modules.
A lot of it came down to investing early in shared understanding - investigations committed to the repo, two-approval PRs, a running Linear board. When six people are building in parallel across services that need to integrate, that overhead pays back fast.
If you want to try it: trafficjam.app. Load Cork. Hit run. Watch the morning commute happen.
Note: although we’ve definitely achieved a lot in these two months, the system is still under active development.
Questions, feedback, or war stories about your own traffic/simulation projects.
Find me on GitHub, Linkedin or the trafficjam repo trafficjam.